When growth meets decline - 23 of 26 EU countries grew their economies while cutting CO₂ emissions
For decades, economic growth and rising CO₂ emissions moved in lockstep. This map shows how that relationship has changed across the European Union. Between 2010 and 2024, most EU economies expanded while cutting their carbon footprint, a pattern known as absolute decoupling. But the strength, drivers, and interpretation of this decoupling vary across countries.
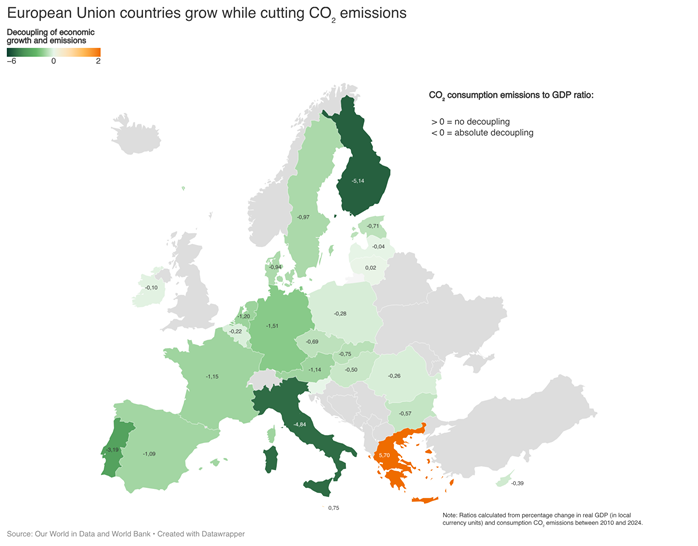
The map shows the ratio between percentage change in consumption-based CO₂ emissions and percentage change in real GDP (in constant local currency units) between 2010 and 2024.
- Negative values indicate absolute decoupling: GDP grows while emissions fall.
- Values close to zero indicate weak or limited decoupling.
- Positive values indicate no decoupling or recoupling.
Using consumption-based emissions accounts for emissions embedded in imports and exports, reducing the risk of overstating progress through offshoring.
- Absolute decoupling is now the European Union norm
23 of the 26 European countries in the sample show negative CO₂/GDP ratios, meaning they achieved economic growth while reducing consumption-based CO₂ emissions. Most values (18/26) cluster between -0,1 and -2,0 suggesting moderate but widespread absolute decoupling. This marks a clear break from historical patterns where growth almost always implied rising emissions.
Context: Absolute decoupling has historically been rare and was long considered incompatible with sustained economic growth. Its prevalence here reflects a combination of structural economic change, efficiency gains, and climate policy, but it does not imply that growth is environmentally sustainable in a broader sense.
- Consumption vs territorial CO₂ emissions
Accounting for consumption-based emissions, as done here, does not materially alter the overall picture from using territorial emissions. The average ratio shifts only modestly (from -0,77 to -1,0), two additional countries move into absolute decoupling (Malta and Lithuania), and the strongest performers remain unchanged (Finland, Italy, Portugal, Germany). This suggests that Europe’s decoupling is not primarily the result of outsourcing emissions, addressing a common critique of territorial CO₂ metrics.
Context: Consumption-based emissions reallocate CO₂ embedded in trade to final consumers rather than producers. While subject to modelling uncertainty, they are widely used to test whether apparent decoupling reflects genuine emissions reductions or offshoring.
- Belgium reveals the limits of territorial emissions
Belgium is one of the countries where the gap between territorial and consumption-based emissions is largest. While territorial CO₂ emissions fell by around 25%, the decline drops to roughly 5% once emissions embedded in trade are included. Belgium remains in absolute decoupling territory, but its position on the scale shifts noticeably.
Context: This case illustrates how adjusting for trade can materially affect national decoupling metrics, even when the overall classification (decoupling vs. non-decoupling) remains unchanged.
- Positive ratio outlier: Greece
Greece is the only country with a strongly positive ratio (+6,77), suggesting no decoupling. While emissions fell substantially (around 38%), GDP also declined (6,7%).
Context: Periods of economic contraction, such as the financial crisis or COVID related downturns, can strongly distort decoupling ratios. Greece’s result reflects the sensitivity of the metric to economic shocks, rather than emissions mismanagement.
- Negative ratio outliers: Italy and Finland
Italy (-4,74) and Finland (-6,04) show very strong decoupling ratios, with modest GDP growth combined with sharp declines in CO₂ emissions. Finland’s ratio is driven by limited GDP growth (8,9%) alongside a 54% emissions reduction. Italy shows similar dynamics, with GDP growth of around 6%.
Context: When GDP growth is weak, decoupling ratios can appear more extreme. This is particularly relevant for Italy, where emissions declined by roughly the European average (around 30%), amplifying the ratio without implying exceptional performance.
Important limitations of decoupling metrics
- Metric sensitivity: results depend on how GDP (real vs. nominal) and CO₂ (territorial vs. consumption-based) are measured.
- Shock sensitivity: recessions and crises can artificially inflate or reverse decoupling ratios.
- Structural effects: shifts from industry to services may appear as decoupling without technological change.
- Global perspective: national decoupling does not guarantee global emissions reductions.
- Sustainability gap: CO₂ decoupling alone does not address resource use, biodiversity loss, or social outcomes.
- Temporal aggregation: chosen time windows can affect results longer windows may mask short-term reversals or recent slowdowns in decoupling trends.
Decoupling is no longer the exception in Europe - but mistaking it for sustainability would be the real risk.