Matisse Cappon obtained his M.Sc. in Finance & Risk Management from Ghent University with distinction in 2023, after which, at the same university, he completed the Advanced M.Sc. in Banking & Finance. His master's thesis dealt with the subject of market timing, for which a collaboration was established with Nationale Nederlanden. In November 2024, Matisse joined Econopolis as an equity analyst within the fund team.
A New Way to Value (Tech) Stocks: The Rule of X – Upside-Down & Inside-Out
- How to Value (Tech) Stocks
Traditional ways to value companies (such as multiples, sum-of-the-parts, discounted cash flows…) already existed long before Econopolis was founded. However, for emerging subindustries (like software SaaS), these tools often fail spectacularly.
A young tech company often reinvests every dollar of revenue back into growth, resulting in negative earnings. This renders the P/E ratio useless. The DCF model is hampered by the extreme volatility and uncertainty of projecting cash flows ten years into the future for a company whose market may not even exist yet.
Therefore, metrics that look further than GAAP Profitability may be appealing.
- The Rule of 40: A Starting Point
The most effective, non-GAAP metric that arose from the venture capital world is the Rule of 40. The principle is simple: a healthy software company's combined annual revenue growth rate and profit margin should equal or exceed 40%.
Rule of 40 = Revenue Growth Rate + Free Cash Flow (FCF) Margin
This simple construct is powerful. A software business can score 40% through:
- Efficient growth (e.g., 20% growth + 20% FCF margin), or
- Heavy reinvestment with strong top-line momentum (e.g., 50% growth + –10% FCF margin).
Yet the Rule of 40 has a flaw: it treats a percentage point of growth as equally valuable as a percentage point of margin, which is rarely true in early-stage tech, where growth compounds while margins can be dialed up later.
- Rule of X: Refining the Metrics
To fix that imbalance, we can augment the Rule of 40 formula by introducing a multiplier to the revenue growth rate number;
Rule of X = (M x Revenue Growth Rate) + Free Cash Flow (FCF) Margin
Where M is a configurable multiplier reflecting how much more the market values growth vs. margin. Setting M = 2 (for simplicity) already produces a more realistic scoring framework. When visualized (Rule of X on the horizontal axis, forward P/S on the vertical) the resulting relationship helps identify:
- Potentially overvalued stocks (priced above the curve)
- Potentially undervalued stocks (priced below the curve)
Even with noise and outliers removed, roughly a third of valuation variation can be explained by this simple model, which is remarkably high for an industry as heterogenous as software. Extreme outliers (like Palantir Technologies) have been left out to avoid overfitting. However, extreme data points (the ones still included, like NET, APP and GEN) are impacting the explanatory power of the model to an increasing extent. More on this later.
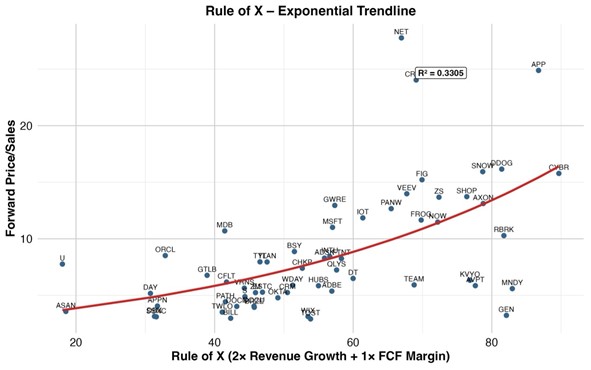
Figure 1: Rule of X, with growth counted double
- The Rule Turned Upside Down: Letting the Market Set the Multiplier
Going even one step further, we can gain additional insights which paint a more macro picture. Instead of defining the multiplier a priori (e.g., assuming M = 2), we can let the market decide what growth is worth today. For every date in your dataset, compute the multiplier M* that maximizes the R² of the exponential fit between Rule of X and forward P/S. This yields:
- A daily optimal growth multiplier (M*), and
- A daily model explanatory power (R²).
This turns the Rule of X into a market sentiment indicator.
Last week, the optimal multiplier landed at 2.18, signaling that the market was willing to pay more than twice as much for a point of growth as for a point of FCF margin.
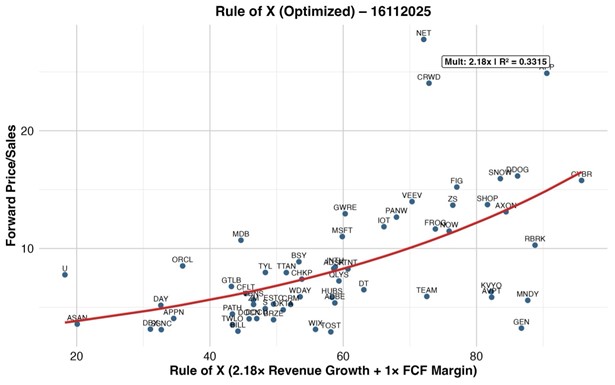
Figure 2: Rule of X, with optimized growth multiplier
Furthermore, plotting the optimal multiplier (M*) and R2 as a timeseries since the beginning of this year, this plot comes to live. A few points may look slightly off (an artefact of model limitations) but the broader story remains intact.
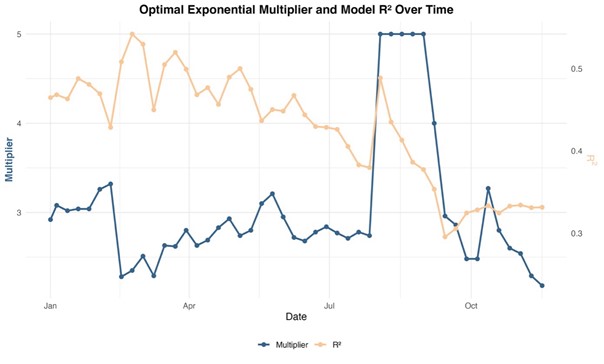
Figure 3: Timeseries M* and R2 in 2025
Interpreting the R2 movement (yellow line):
High R2 (Strong Fit): When the R2 is high (approaching 1.0), it confirms that the market is behaving consistently according to the Rule of X framework. The optimal multiplier (M*) identified on that day is a highly reliable measure of the market's growth premium.
Low R2 (Weak Fit): A dip in R2 suggests the market is pricing stocks inconsistently, or that non-fundamental factors (like macro volatility or unique company events) are overpowering the Rule of X relationship.
The R2 value has been dropping all year long as the software landscape is more divided than ever. More on this in point 5 of this article.
Interpreting the M* movement (blue line):
When M* rises: This signifies that the market is willing to pay a premium for growth and is generally risk-on. A percentage point of growth is valued much more highly than a percentage point of FCF margin. This typically happens during periods of low-interest rates or aggressive economic optimism.
When M* falls: This indicates that the market is becoming defensive and risk-averse. Investors are demanding immediate, tangible profitability. A percentage point of FCF margin is now highly prioritized over a percentage point of growth. This often coincides with rising interest rates or economic uncertainty, as the depressed values for M from February to April, for instance, reflect market uncertainty due to the DeepSeek release and the tariff announcements of U.S. President Trump. The hesitance around the AI trade in recent weeks is also reflected by a decreasing M*.
Rule of X: AI Stocks and the Divisive Narrative
The developments around Generative AI have created a divisive narrative within the software sector: the outperformance of "AI Infrastructure" winners versus "Vertical Market & Application" strugglers. This division is clearly quantified by their positioning relative to the Rule of X curve. This divisive narrative is also reflected by the decreasing value of R2, indicating a lowered explanatory power of the Rule of X model, since not all software companies may not be assessed equally strong going forward in the Age of AI.
The Great Divide: Infra vs. Vertical
The optimal Rule of X curve (shown in figure 2, fitted using the maximized R2) acts as the market's current expectation for fair value.
Infrastructure Software (The AI Winners): Companies providing the foundational tools and platforms enabling AI development (e.g., observability, data pipelines, modern databases) are being priced above the exponential best-fit line. Investors are assigning them an "AI premium" based on future scale and integration into the new tech stack.
Examples lately seen trading above the curve include Datadog (DDOG), Snowflake (SNOW), and MongoDB (MDB).
Vertical/Application Software (The AI Challengers): Companies focused on specific workflows or applications (where AI disruption poses an existential threat or margin pressure) are often priced below the line. The market is discounting them due to perceived vulnerability or the necessity of costly re-tooling.
Examples lately seen trading under the curve include Klaviyo (KVYO), Adobe (ADBE), and Atlassian (TEAM). Their current P/S ratios reflect market skepticism regarding their future growth trajectory or margin sustainability.
By dynamically tracking the optimal Rule of X multiplier, investors can quantify the market’s conviction in the future profitability of AI-driven revenue; a conviction that is otherwise invisible in static P/E ratios.
Disclaimer: This article is not investment advice. No stock should be bought or sold based solely on this content.
comments powered by Disqus