Toon has a Master’s Degree in Civil Engineering (major in Energy) from the KU Leuven. He completed a 6 month internship as Derivates Analist. He work as a Junior Climate Consultant for Econopolis Climate and works on advisory projects related to climate & energy. Toon is also founder of Stroomloop, a unique trailrunning experience.
Four Figures to Summarize the 2022 Renewable Year
The International Energy Agency (IEA) and the Renewable Energy Agency (IRENA) have been busy collecting data on the installment of power capacity in 2022. With most of the results out now, we give four figures based on their data that wrap up the busy year of renewable energy in 2022. Most of the graphs work with Gigawatts (GW) as a reference
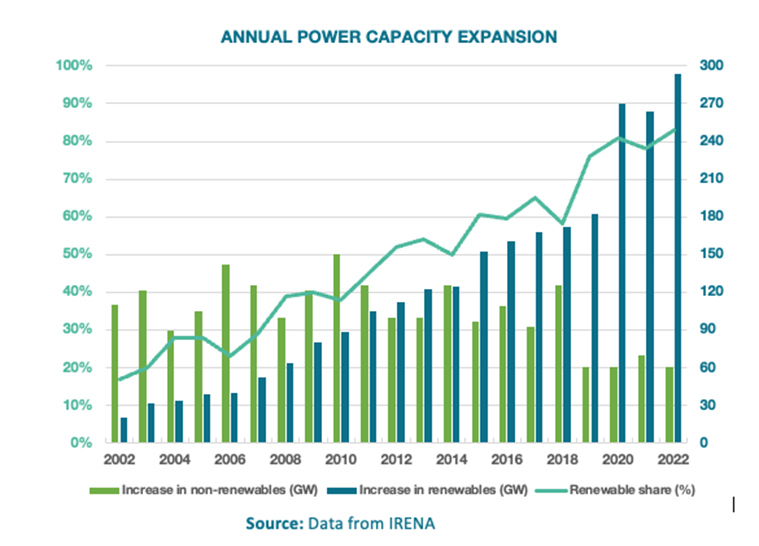
1. Renewable Share in Capacity Expansion Rises To An All-Time High
83% of installed capacity in electricity generation is renewable. That number is still rising, as it does for the past ten years. The share is rising because both the installed capacity in renewables is increasing and the non-renewable capacity is decreasing.
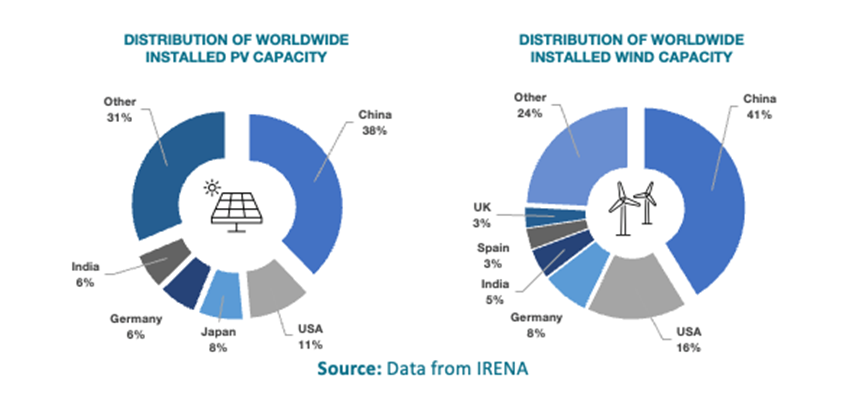
2. China Remains the King Of Renewable Energy
In 2022, a mind-boggling 86 GW of solar PV came online in China. This is more than 12 times the total installed capacity in Belgium, and 43% of all installed PV capacity in the European Union, that was added in one year. The same goes for wind capacity that was installed in China, where almost 37 GW came online last year. This capacity addition equals the total installed capacity of Belgium and UK combined, two European pioneers in offshore wind, who are now definitely surpassed. China now holds 38% of all worldwide installed PV capacity and 41% of the installed wind turbine capacity.
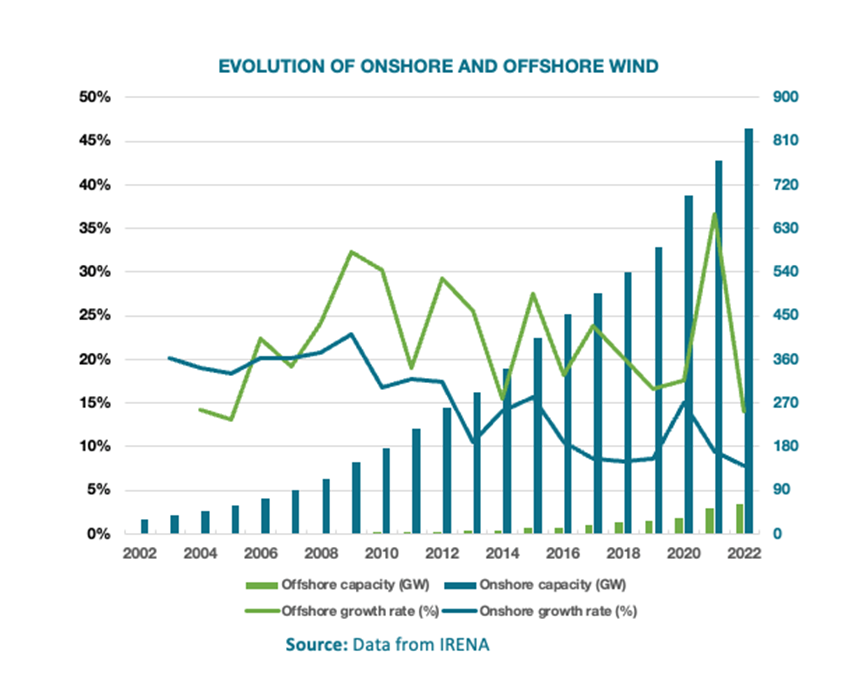
3. Wind Energy Is Still Booming Business, But Onshore Is Slowing Down
Wind turbine capacity has been characterized by exponential growth in the last decade, as proven by the consistent double-digit growth rates. The declining growth rate for the onshore wind capacity shows that the industry has started to deviate from the exponential trend. Offshore wind on the other hand, an industry where Belgium played a pioneering role in during the past decade, still shows consistent growth around 20%.
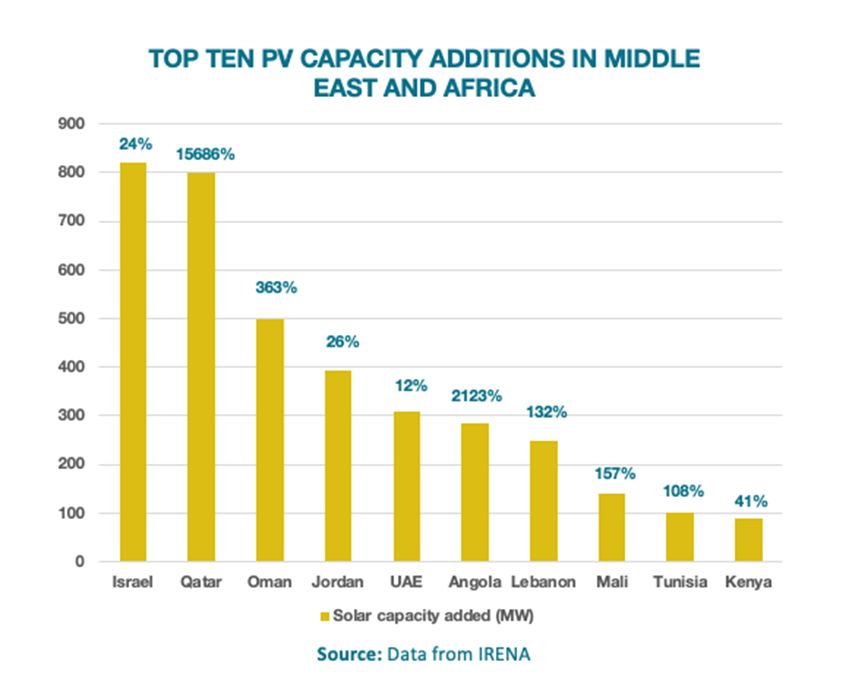
 4. Solar PV Gains Traction In Middle East And Sub-Saharan Africa
Countries in the Middle East like Oman and Qatar have seen high relative increases in the past year; showing that they are discovering the potential of their cheap and abundant solar energy. Other Sub-Saharan countries, such as Angola or Mali, were also characterized by large relative increases of the installed PV capacity.
*One GW of electric capacity corresponds to the output of one nuclear plant in Doel. One sidenote has to be added; since renewable photovoltaic (PV) and wind energy are also expressed in terms of capacity, this is their peak capacity. Most of the time, they will not deliver at full rate, making the capacity comparison between renewables and ‘firm’ capacity, such as nuclear, a bit harder than one would expect.
About the author

Toon De Vil
comments powered by Disqus