Calm before the storm? The VIX-fear index hits a one-year low.
The stock market has been experiencing a period of calm in recent days and weeks. This contrasts with the heightened volatility and uncertainty that characterized the market last year, and last March. Investors seem to have regained their confidence in the stability of the market, with hopes pointing towards a positive outlook.
Resilient economic data, benign macro data flow, okay earnings, and a calmer interest rate market likely explain why volatility is down compared to a much more eventful 2022. Additionally, the market has already priced in different risk factors such as the Russian war, inflation, and expected rate hikes into the current valuation. On the other hand, the market is also awaiting further indications including the next Federal Reserve meeting (about a new hike in the interest rate) in May and companies’ first quarter results. This likely explains the current status quo and wait-and-see approach from most investors.
This calm on the stock market is also reflected in the Volatility Index (VIX), which is a key indicator in the world of finance that measures the expected volatility of the US stock market over the next 30 days. It is often referred to as the "fear index" because it reflects the degree of uncertainty and nervousness that investors have about the market. The VIX is a forward-looking measure on the S&P 500 index, providing an estimation of investors' expectations for future market volatility.
The VIX can be thought of as a weather forecast for the financial markets. Just as meteorologists use various indicators and data to predict changes in the weather, financial analysts use the VIX to forecast the magnitude of near-term price volatility in the stock market. Just like a stormy weather forecast may prompt people to prepare for rain or snow, a high VIX may prompt investors to adjust their portfolios and take measures to protect themselves against potential losses from market turbulence. On the other hand, a low VIX can be seen as a sign of sunny skies ahead, indicating that investors are more confident and that the market is expected to be less turbulent in the near future.
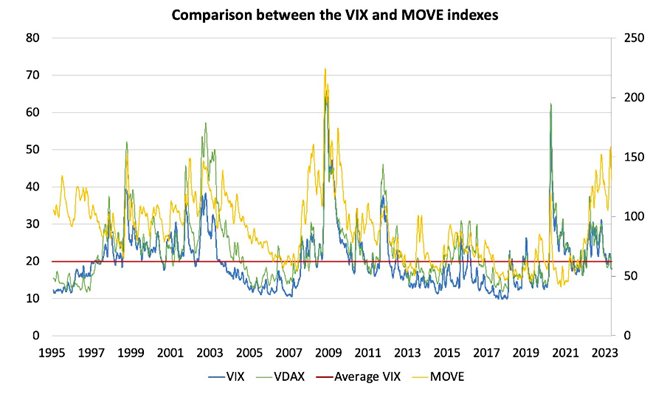
Since its inception in 1990, the VIX has experienced several notable spikes during times of market stress and uncertainty, including the dot-com bubble burst in 2000, the global financial crisis in 2008, and the COVID-19 pandemic in 2020. However, the VIX has also experienced downward trends reflecting long periods of relatively stable economic growth and low inflation. Last week, the VIX dropped to below 17 points, a level not seen since January 2022. The VDAX, which is the European equivalent of the VIX, can also be observed. As global macroeconomic factors affect both European and US equities, VDAX and VIX tend to exhibit a strong correlation. However, country or region-specific incidents may cause them to deviate from each other.
Overall, the recent calm on the stock market is a positive sign for investors, and it is hoped that this trend will continue in the coming weeks and months. The downward trend in the VIX index suggests that investors are feeling more confident and that the market is stabilizing. While there are still risks and uncertainties, the overall outlook appears to be improving.
For the VIX to experience an increase in the future, there must be a sense of panic. Expectations for anticipated catalysts must deviate in an unexpected manner or magnitude, or a new "unknown unknown" must appear to cause an upward "shock" in the VIX level.
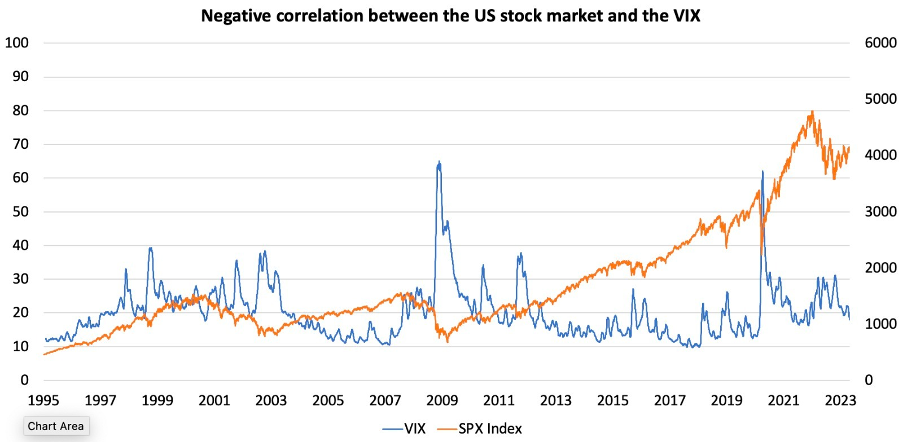
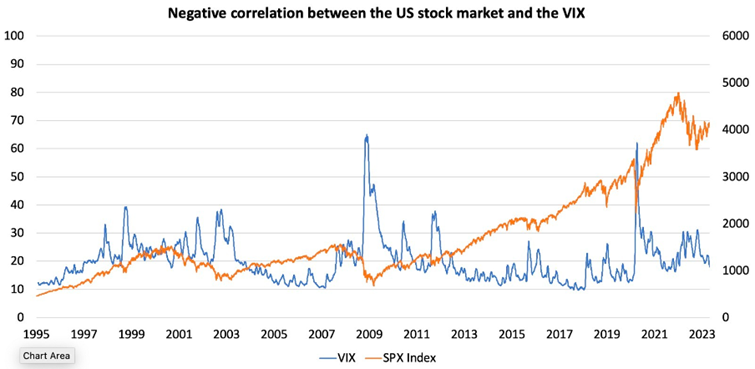
From a statistical perspective, there is a well-known negative correlation between the S&P500 and the VIX. When the stock market is performing well, the VIX tends to be low, and vice versa. However, it's important to note that this relationship is not always stable and can be affected by various factors.
MOVE
In parallel with the VIX, there is also a similar indicator called the MOVE, which measures the expected volatility of interest rates on US Treasury bonds. The MOVE is used by investors to assess the level of uncertainty in the bond market and tends to spike during periods of economic and financial turbulence, making it a useful tool for evaluating market stress in the bond market.
The index has reached historical peaks during significant events that have disrupted the financial market. For example, in October 2008, it reached a historic peak due to the global financial crisis. Investors fled out of risky assets and turned into US Treasury bonds as a safe haven, leading to a surge in demand for these bonds and an increase in their prices. This increased demand resulted in a higher bond price volatility, contributing to the rise in the MOVE index.
A similar phenomenon occurred in March 2020, when the index spiked due to the uncertainty caused by the Covid-19 pandemic. Contrary to the VIX index, the MOVE index did spike in March of this year, following the bank run on the Silicon Valley Bank and Signature Bank, and the culminations of problems at Crédit Suisse. The MOVE reached a peak not seen since the Big Financial Crisis in 2008, clearly reflecting the uncertainty surrounding the banking industry. While the stress in the banking sector has diminished, as suggested by the absence of new worrisome headline news, the level of uncertainty remains significantly higher than historical averages, as evidenced by the still elevated level of the MOVE index.
This shows that there is no clear correlation between the volatility index of the stock market (VIX) and of the bond market (MOVE). However, an increase in the VIX tends to lead to contemporaneous and delayed increases in the volatilities of Treasury notes. The VIX could be considered as a predictor for the volatilities of Treasury notes, but the latter volatilities do not predict the stock market volatility.
In conclusion, the VIX and its counterpart MOVE are key indicators used in market sentiment analysis, providing investors with insights into the perceived level of risk among market participants. They can help investors make informed decisions and anticipate market fluctuations, contributing to better risk management in a dynamic financial environment. While the volatility indicator for the stock market has decreased and reached one-year lows, this is not the case for the bond market, where the MOVE index has been increasing since the Covid-19 crisis and has been exacerbated by the panic in the banking sector.
However, it is important to note that stock market volatility is a reality that investors should be prepared for. Although the situation is currently more stable, economic, political and geopolitical risks can still cause significant fluctuations in the markets. Therefore, we should remain vigilant and carefully monitor economic and political developments so that they can quickly adapt their investment strategy if necessary.